
Arizona Stop
Bringing the "Idaho Stop" to Arizona
Home - other States - Statistics - Proposed Legislation - Contact - Links
Statistics for the Idaho Stop
Idaho had zero bicyle fatalities in 2015. 2016 saw the most fatalities at 6. (other years: 2012 - 2, 2013 - 3, 2014 - 2)
This means even in the worst year for Idaho, their fatality rate was less than 0.00000349% or 3.49 fatalities per million people
This is still less than Arizona's rate for the same year:
In 2016 Arizona had at least 31 fatalities that's 4.47 per million. In 2017 the number increased to 32.
In other words, Arizona had 1 more fatality per million residents than Idaho, even during Idaho's worst year in recent history.
Here is the official government report on bicycle crashes for 2016 https://crashstats.nhtsa.dot.gov/Api/Public/ViewPublication/812507
(2016 is the most recent data - the report was released May 2018).
Intersections are not that dangerous:
Only 30% of bicycle fatalities occur at intersections:
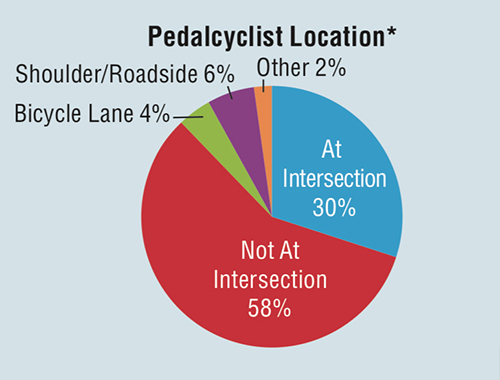
source: https://crashstats.nhtsa.dot.gov/Api/Public/ViewPublication/812507
This chart shows that the most dangerous area for bicyclists is outside of intersections.
Alcohol:
Nationwide, about a third of all crashes/fatalities involved alcohol. Either the driver of the bicyclist or both had some alcohol in their system.
Reducing the number of DUIs will also reduce the number of bicyclists being hit by automobiles.
Distratcted Driving:
Texting while driving or using smart phones while driving has been tied to higher numbers of crashes.
The increase in the percentage of bicycle fatalities nationwide can be tied to the increase in the use of smart phones.
More Resources:
Arizona Bicyle crash facts and laws: http://azbikelaw.org
all content of this website Copyright 2024 Mark S. Haughwout
web design: Mark S. Haughwout